Home Blog Page 65

S&P 500 ready for another major drop

0

What goes up must come down. This is the worst drop in market history in terms of magnitude. Yesterday was the largest single-day drop in many indexes. We’ve watched the market blow through level after level.

So, where does it end?

The crazy week continues as reports are showing this is the worst week since the financial crisis in 2008. Like I said yesterday, volatility is high, so options will be a lot more expensive and moves will be a lot quicker.

Right now, much of the moves are based on global news and the corona virus, versus any individual company news. That makes the activity on the scanner less meaningful right now.

In fact, many “good news” releases that I’ve seen this week are treated as an event to sell and get out. The markets are opening up down another about 300 points and it’s anyones best guess where we go today.

We could rally 500 points or fall another 500.

My gut tells me not many people are going to want to hold over the weekend on the long side, unless we get some intraday positives headlines.

SPY could go parabolic based on technical chart

0

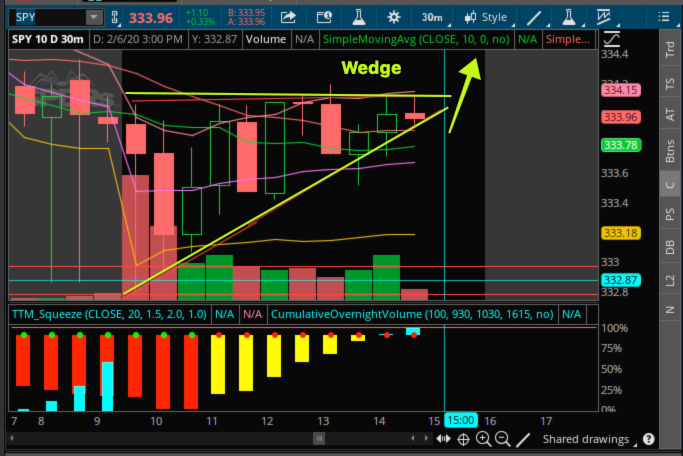
Those that have been watching the SPY all day might believe it might be setting up for a move higher from here. Why so ? Here is the chart that the technical traders are seeing that explains why I think this:

The SPY has set up in a wedge pattern today, using $334.12 as the resistance line. Meaning lower lows all day long. Additionally, as you can see it has set up on a squeeze on the half hour and the momentum is turning up.  If it can break up over that resistance line I think it could run and we could profit. So a tech savvy trader might have bought the calls from the morning: FEB 12 20 $335 Calls on the SPY at $1.25 and then looking to hold them for 10% or more if it can break out here. Close under $333.50. Some risk here, but its worth giving it a shot.

Wall Street looking to bounce back with green futures: SPY calls

0
WallStreet_bounce

Futures are up this morning. The SPY is currently sitting at 324.01 in the premarket.

In pre-market since Friday it has risen but not getting higher than 324.50. In the premarket charts at the moment we see that the 10 moving average line is slightly above the 20 moving average line on 5,10 and 15 minute charts.

Additionally, volume is about the same as Friday. The SPY seems to be headed for a gap up here of almost a point. Given the TRIN end of day Friday, the futures currently and the moving averages at the moment, Wall Street may be eyeing for a move up today if the SPY doesn’t open too high.

If it jumps right away, the we know for sure that the gap will be filled today. But if it drops, I would wait for a reversal off support line or if it just moves sides ways I’ll look for buying volume to confirm my decision. 

Volume, like Friday, will be a big indicator today of where we are going. In order for this trading plan to be in play SPY must remain trading above that key support level near 322.50. If I see this it would trigger a buy to open followed by sell to close CALL option move today.

Finally, know that because of recent volatility, these options will be more expensive than usual. Resistance:  324.11, 324.23, 324.50 Support: 323.63, 323.33, 323 Today’s Trade of The Day is SPY February 7 325 CALLS

SPY continues to dip under coronavirus fears

0

Markets started the day with a sizable down move before recovering a bit. We’re still down for the day, and things don’t look particularly bullish. I get a sense they’ll want to sell into the close…more of a hunch then something I’ll bet on.

The VIX is up almost 6%, with the VVIX back above $100. Gold isn’t up as much as Wall Street would have expected, but it still looks strong. Crude oil is down over 2.5% again as is natural gas. 

At this point the down move on natural gas is getting beyond reasonable. This is going to start causing a problem for drillers, especially the small guys. While the Fed is easy with funds, it may not be enough to prop up some of these guys.

On the earnings front, MSFT blew away estimates along with TSLA. Tesla isn’t completely done squeezing the shorts. FB took the opposite route and reported results that didn’t inspire investor confidence.

Right now we’re holding the 200-period moving average on the SPY at the moment. That is providing support for the market. The question is whether it bounces or just sits here. If it sits here, then it makes it more likely we head lower.

Markets sell off as democrats reveal Trump’s obstruction was unprecedented

0

Markets took a bit of a plunge off the open, but appear to be making a recovery. Let’s see how the market closes the day. It’s worth looking at the weekly chart for a moment. 

If the market closes at or below $330.90 on the SPY, that effectively creates a reversal candle on the weekly chart.

SPY Weekly Chart

On the daily chart, if we close below yesterday’s low, then I see us quickly filling the gap at $328.19, but more likely headed to the lower gap at $324.45. If we do get a downturn, I expect we’ll ultimately find support around $310.

SPY Daily Chart

When we get down to the hourly chart, there’s a bearish money-pattern crossover that formed. That doesn’t bode well for the markets right now.

SPY Hourly Chart

Otherwise, Crude is down over 2%.

Wall Street may derail unexpectedly Five Below Inc (NASDAQ:FIVE), GrubHub Inc (NYSE:GRUB), GSX Techedu Inc (NTSE:GSX), Harley-Davidson Inc (NYSE:HOG), Shopify Inc (NYSE:SHOP)

0

Something unexpected could derail stocks, temporarily, but I think they’d come right back as we’ve seen time and time again. With that said, my aggressive approach to trying to time the ‘overall’ market top backfired. However, there are great short setups in ANY market and that’s where I’ll turn my energy too now. If you follow along with Weekly Windfalls, what you’ll now see me doing is on some of the trades I sell Calls on, I’ll buy buying Puts too here in Smoke Signals. And there’s a specific way I’m going to do that so I’ll get you the video lesson this week so you know what I’m looking at. 

For now Five Below Inc (NASDAQ:FIVE), GrubHub Inc (NYSE:GRUB), GSX Techedu Inc (NTSE:GSX), Harley-Davidson Inc (NYSE:HOG) and Mosaic Co (NYSE:MOS) could interest Wall Street. GSX is going supernova so I’m not looking for trouble there but when the top is in, I’ll look for Puts on this one or just short the stock.

All of the others are bearish chart patterns with HOG and FIVE being the weakest and bumping up against the 8 EMA. The idea is to accumulate a Put across several days during the bearish accumulation and sell it for profit into the next leg down.

Shopify Inc (NYSE:SHOP) is my last open short in this newsletter and it went against me Tuesday on an upgrade. I will cut my loss on SHOP and move on from the ‘overall’ market top trades as overbought can stay overbought for long periods of time, especially if the President pushes hard for another round of interest rate cuts. 

Acasti Pharma Inc (NASDAQ:ACST) is surging for all the correct reasons

0

As a trader a perfect trade would be to buy Acasti Pharma Inc (NASDAQ:ACST) today at .83. First target will be a breakout over $1 and into the gap above.

Yesterday, the company reported negative trial results (which I suspected to happen) and shares fell from about $2 to below $1.

That has created a big “gap to fill” for the stock back up to $2, where there is no trading resistance.

Now, the key here is that the reason why ACST’s trial failed looks to be that the way they ran their trial was wrong. Their placebo group was constructed in a way so that the trial didn’t produce statistically positive results.

That flaw is due to how the management team constructed the trial.

However, there is still hope here. Their trial called Trilogy 2, comes out in mid-February.

So, there is both fundamental and technical reasons for a bounce into the gap above.

SPY ready to close red into the weekend

0

The market made a big move higher yesterday and kept running up to all time after-market highs above 328 before coming back down to where it closed.

Today in the pre-market the Spy bounced off support at $326.75 and has made lower highs. In the premarket charts at the moment we see that the 10 moving average line is below the 20 moving average line on the 5 and crossing on the 15 minute charts.

The SPY is in another tricky spot this morning. Futures are slightly red, overseas markets are down, but we have had some positive earnings news and the spy looks like it might open close to where it closed. It has shown potential to move higher given what we saw the past few days but it’s a tough call here.

I will make this call based purely on our indicators. I believe because of the moving averages at the moment, the SPY could pull back this morning before possibly continuing higher.  If it drops, it might happen quickly right at the open, but if not, I would wait for a pull back at resistance or a head and holders pattern to confirm the move lower.   

In order for this trading plan to be in play SPY must remain trading below that key resistance level near $328.15. If I see these it would trigger a buy to open followed by sell to close put option move today.

Resistance:  327.95, 328.15, 328.25 Support: 327.61, 327.41, 327.21 Today’s Trade of The Day is SPY January 17 327 Puts

ETF (GDX) could surge this week

0
70423815 - happy young woman on a blue background

Gold miner ETF (GDX) seems primed for a bounce play. 

I think there’s a good chance we could see some chop in the market this week, so I am really liking gold for a move higher. 

Generally, gold prices and stock prices move inversely. Meaning, when stocks move lower, gold (and gold miners) will move higher. This is due to the fact that investors see gold as a suitable hedge against a weak market. 

Here’s what I’m seeing on the hourly chart:

GDX is finding support at the 200 hourly line, and it’s looking like it wants to bounce right off of it. I will be watching for a 13/30 crossover, which looks like it is setting up nicely. I think a crossover to the upside and any weakness in the market will mean a quick and explosive move for GDX. 

I will stop out of this trade if GDX closes definitively below the 200 hourly line, which is acting as a good support level. I am looking for a breakout to around $30 to take at least some profits off the table. As long as the crossover remains in tact and prices hold around the 200 hourly line, I would be willing to add to this trade.

The contract that I will go with is GDX Jan 31 2020 28 Call @ .90.

Kohls (NYSE:KOHL) technical chart calls for a rally

0

Here’s a bit of a curveball for you. Today’s idea comes off a potential reversal in Kohls (NYSE:KSS). I don’t love the stock, nor do I love retailers. But, this isn’t a bad setup here.

KSS Daily Chart

The stock crashed into a support level at a previous swing low. It reversed and finished the day higher. This all happened on tremendous volume. That’s a good indication that the stock doesn’t want to move lower.

There’s two ways to play this trade. First would be an outright long through stock or call options against the low of yesterday’s candle. The other way would be selling a put spread.

Normally, I’d favor the put spread. You don’t always know when the stock could take off. However, things are unusually bullish at the moment. That could give this a huge rip the other direction that would pay of handsomely.

However, there is one key to my decision. I want to look at the implied volatility. The stock slipped on disappointing holiday sales, not earnings (which aren’t until March 3rd). As stocks move higher they tend to lose implied volatility. That means call options have to fight on another front.

That’s why I want to look at the IV rank. That tells me the percentile rank for the current IV compared to the prior year. It’s currently at 20.6%. That’s pretty low.

So, that leaves both choices as viable alternatives. If the IV rank was much higher it would be a put spread all the way. Whenever IV is high you want to be a seller of options. When it’s low you want to be a buyer. 

An IV of 30 is basically a midpoint for options.