 Pemvidutide Shows Promising Results in Obesity Treatment: A Detailed Analysis from the MOMENTUM Trial")
 Announces Stock Consolidation, Sees Significant Surge")
 Achieves Milestone: Positive Results from Mino-Lok® Phase 3 Trial")
 Revolutionizing Healthcare Through AI and Education")

Those that have been watching the SPY all day might believe it might be setting up for a move higher from here. Why so ? Here is the chart that the technical traders are seeing that explains why I think this:
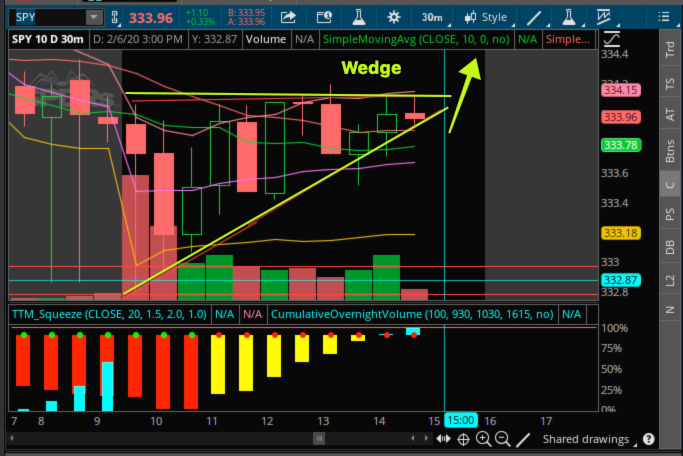
The SPY has set up in a wedge pattern today, using $334.12 as the resistance line. Meaning lower lows all day long. Additionally, as you can see it has set up on a squeeze on the half hour and the momentum is turning up. If it can break up over that resistance line I think it could run and we could profit. So a tech savvy trader might have bought the calls from the morning: FEB 12 20 $335 Calls on the SPY at $1.25 and then looking to hold them for 10% or more if it can break out here. Close under $333.50. Some risk here, but its worth giving it a shot.
 Sees Unexplained Surge: Could Retail Traders Be Driving the Rally?")
 Achieves Milestone: Positive Results from Mino-Lok® Phase 3 Trial")
 Reports Q1 Financials: Revenue Dips But Strategic Gains Promise Brighter Horizons")


 Pemvidutide Shows Promising Results in Obesity Treatment: A Detailed Analysis from the MOMENTUM Trial")
 Announces Stock Consolidation, Sees Significant Surge")